Friday, February 21, 2014
Choropleth Map
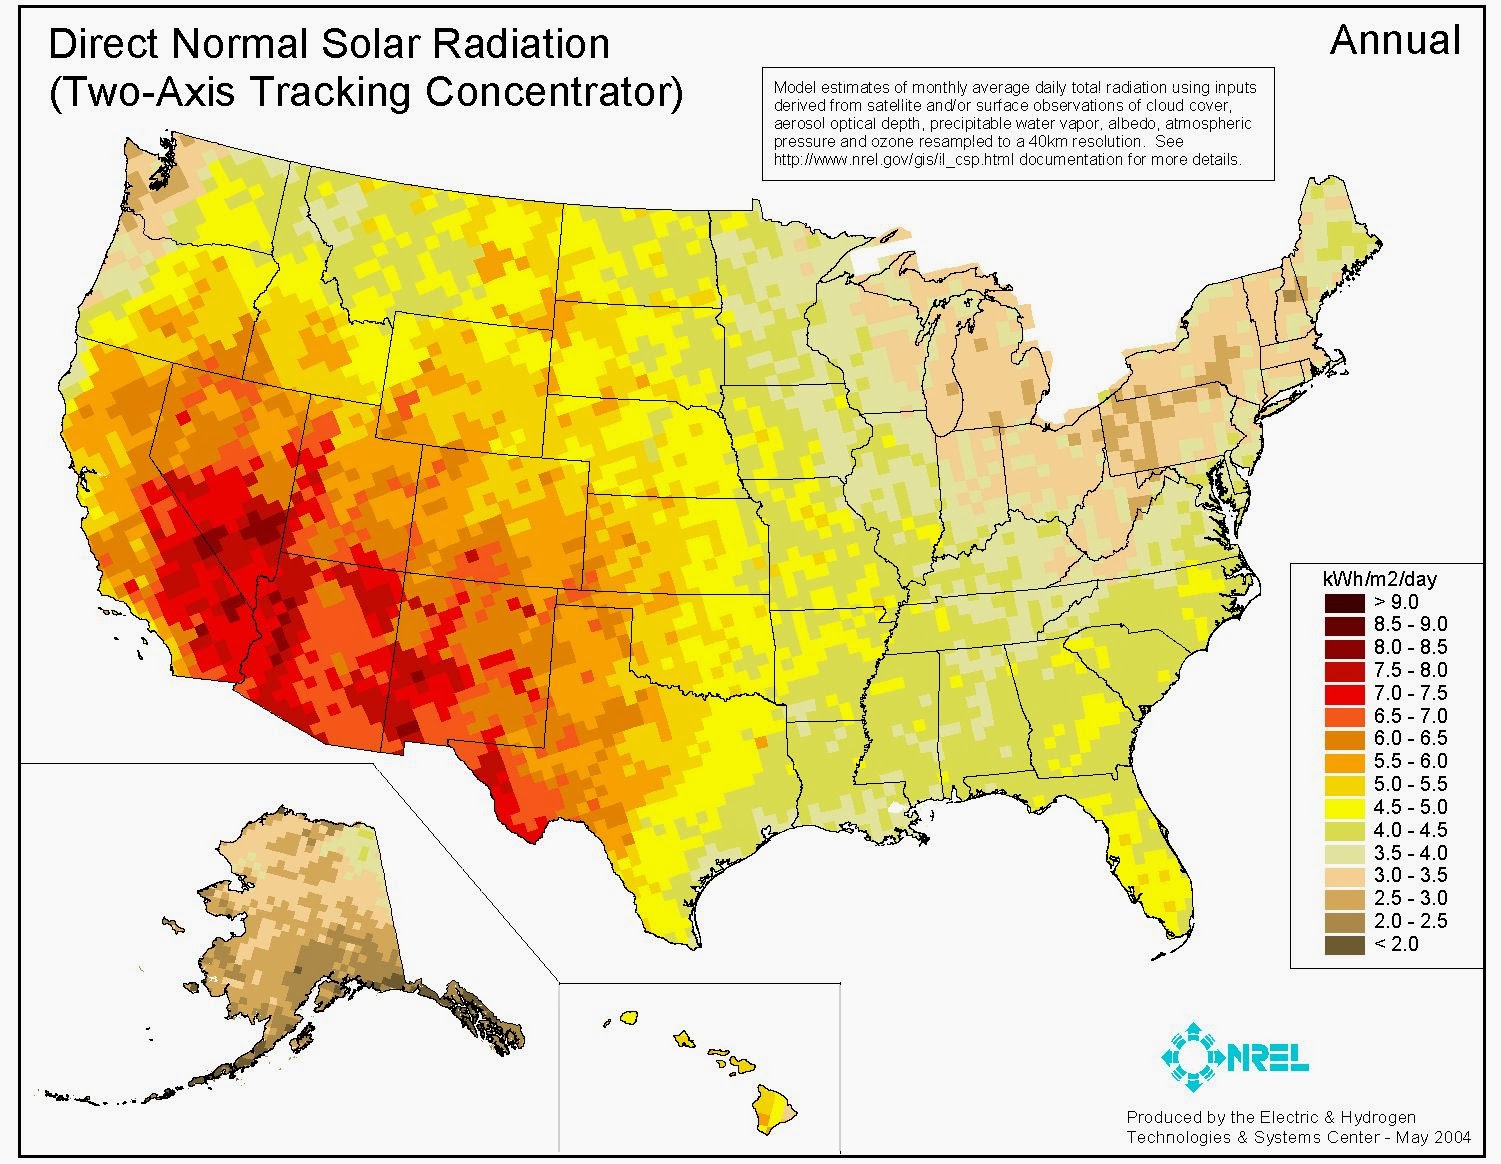
This map demonstrate the direct solar radiation
annually. A legend is provided to show the intervals and the corresponding
colors for a different amount of radiation. This max uses pixels to display its
information. This is known as a raster data. Each pixel corresponds to a value
representing the amount of solar radiation. Each pixel has a latitude and
longitude, so it is tied into the real world surface. A collection of daily satellite readings have
been compiled and entered in to display this information and determine where
the concentration of radiation is. http://www.nrel.gov/gis/solar.html
Subscribe to:
Post Comments (Atom)
No comments:
Post a Comment