http://www.theguardian.com/news/datablog/2009/apr/13/week
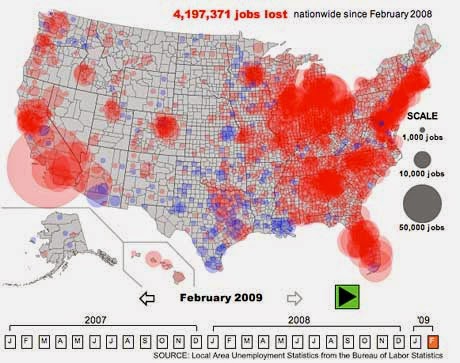
A Continuously variable proportional circle map is a map that uses circles to represent data. These circles vary in size depending the the proportion of the variable being measured for the land area. An example of this can be seen above in this Continuously variable proportional circle map. This map shows the unemployment over all of the US. The large circles over the southern portion of California demonstrates that there is a large number of people unemployed in that region of California.
No comments:
Post a Comment